
Introduction: Ditch the Heavy Lifting for a LoFi Solution
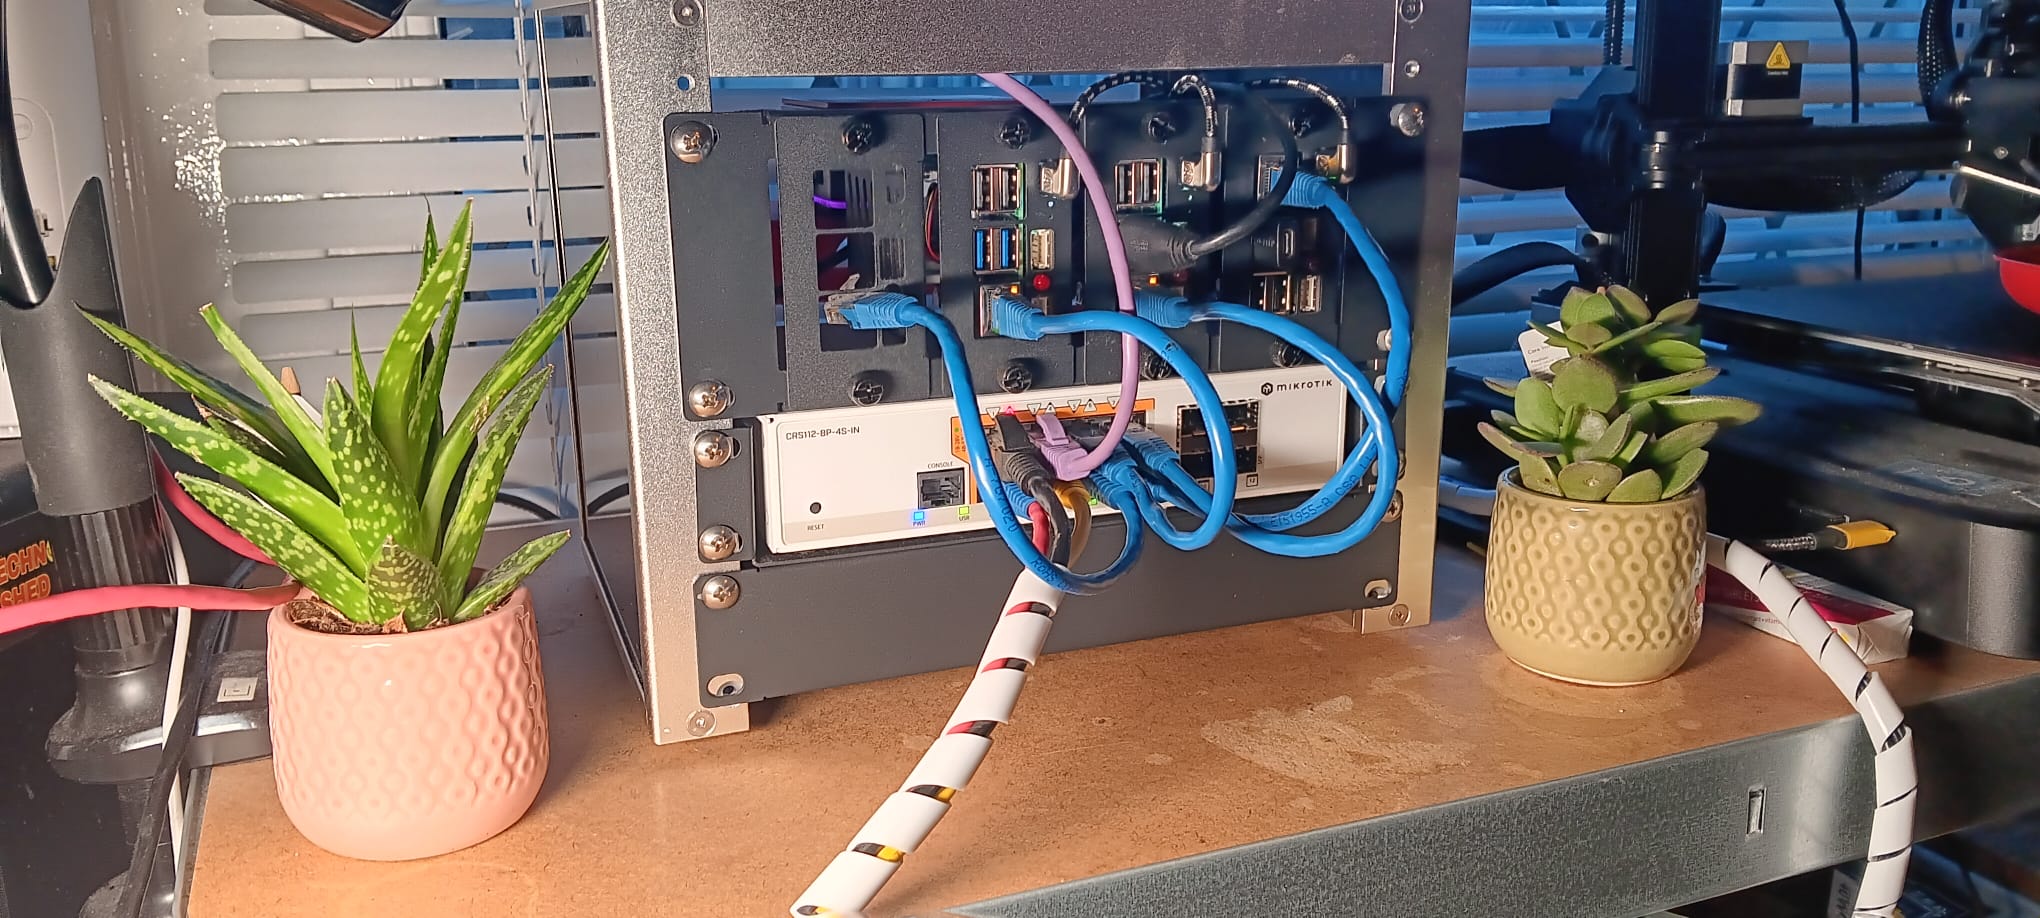
If you run a home lab, a few servers, or even just a set of Docker hosts like I do, you know the struggle: you need a clear, reliable overview of your network services, but you don’t want the bloat. Deploying heavy-duty monitoring suites like Prometheus and Grafana can feel like overkill—an unnecessary amount of complexity just to see if your media server is alive.
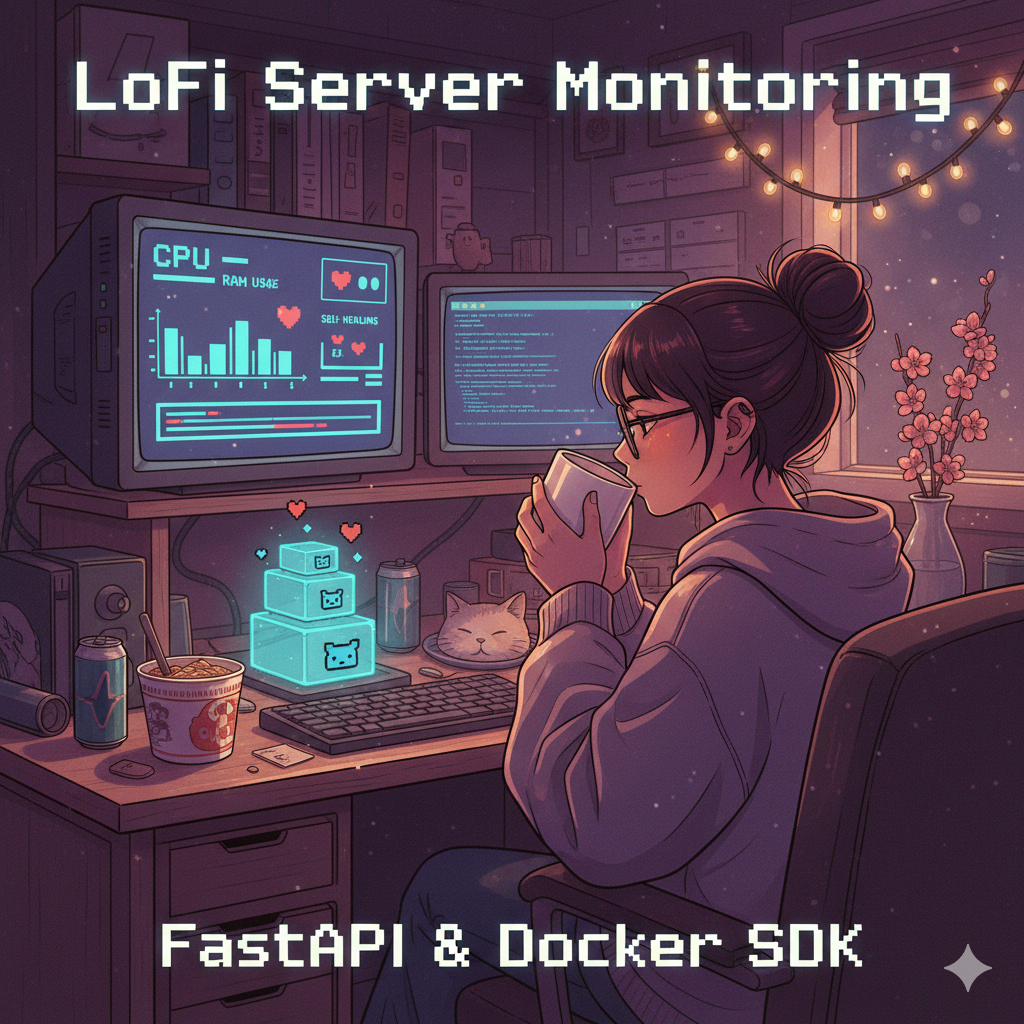
This is where the TechnoShed philosophy comes in: we aim for LoFi Solutions for a Digital World. The goal was simple: a fast, easily maintained dashboard that could tell me, at a glance, the status of my Docker containers, the health of my two remote Docker hosts, and even external non-containerised services like my Jellyfin server.
Instead of wrestling with complex configurations, we built a custom solution using a high-speed, modern combination: FastAPI to handle the data acquisition and heavy lifting, and the simple, visual Node-RED Dashboard for the clean front-end display. This post dives into the code—specifically the brain of the operation, our custom Python application—and shows you how we turned a basic monitoring idea into a powerful, self-healing tool.
The Technical Core: FastAPI and the Docker SDK ⚙️

The most crucial design decision in this project was avoiding the need for complex, resource-heavy agents on every server. Instead, we built one centralised, lightweight brain to do the collection: a FastAPI application.
Why FastAPI? The Centralised Hub
FastAPI is a modern, high-performance Python framework. We chose it because it’s asynchronous, meaning it can efficiently connect to and wait for multiple Docker hosts simultaneously without slowing down. It acts as a dedicated REST API endpoint that serves only one purpose: providing clean, consolidated server status data to the front-end.
This approach means our Node-RED Dashboard only needs one simple HTTP Request node to fetch a single JSON payload. It never needs to worry about authentication, complex parsing, or connection errors to the Docker hosts—FastAPI handles it all.
Securely Querying Remote Docker Hosts
To gather the metrics, the application uses the Docker SDK for Python (import docker). The key is how the fetch_docker_server_status function connects:
- Remote Connection: We don’t rely on local socket files. Instead, the code connects to each host over TCP using a defined IP and port (
tcp://10.0.1.x:2375). - Container Whitelist: We use a
CONTAINER_WHITELISTto ensure the dashboard only displays services we care about (e.g.,vops-app,homeassistant). This instantly filters out irrelevant system containers and keeps the dashboard purely LoFi and functional. - Advanced Metrics: The
_parse_container_datafunction calculates Active Memory Usage (subtracting the cache size from total usage) and CPU Percentage using the standard Docker formulas, ensuring the displayed numbers are accurate and not misleading.
Code Snippet: The FastAPI Endpoint
This is the function that runs in a thread pool to avoid blocking the API, ensuring the dashboard remains incredibly responsive:
Python
@app.get("/api/status", response_class=HTMLResponse)
async def get_service_status():
    """API endpoint to refresh data and return just the content body HTML."""
    # ... data fetching logic runs here ...

    # Return raw HTML content for the JavaScript to replace
    return HTMLResponse(content=docker_sections + external_sections)
In short, FastAPI provides the power of a commercial monitoring back-end, but packaged into a custom, portable, and easily maintained solution that truly embodies the LoFi ethos.
Advanced Monitoring: Self-Healing and Grouping 💡

A true LoFi solution isn’t just about simplicity; it’s about intelligence. We engineered the FastAPI application to do the heavy lifting of observation and organization, ensuring the dashboard requires minimal intervention from you.
1. Log-Based Error Detection (The Self-Healing Element)
One of the most valuable features we built is the ability for the dashboard to detect problems before you see a crash. The _parse_container_data function doesn’t just ask, “Is the container running?”; it asks, “Is the container reporting any critical errors in its logs?”
- The function pulls the last 10 lines of the container’s output.
- It then scans these logs for critical keywords like
"error","exception", or"fail". - If a critical keyword is found, the error is displayed directly on the card, and the card’s colour shifts to a prominent red. This acts as an immediate visual alert, allowing you to troubleshoot without logging into the host or running
docker logs.
This proactive approach saves time and makes the dashboard a genuinely useful first-line diagnostic tool.
2. Intelligent Stack Grouping
To combat dashboard clutter, we implemented a sophisticated grouping system. Instead of a long, confusing list of container names, the code uses a reliable Docker feature: the com.docker.compose.project label.
- Our FastAPI script reads this label and dynamically organizes the dashboard into logical sections like “Media Stack” or “Dev Stack.”
- This not only makes the dashboard easier to read but also scales automatically. When you add a new service via Docker Compose, it lands in the correct group instantly.
3. Usability Features: One-Click Access
Finally, we ensured the dashboard was efficient to use by adding direct access. For any container with an exposed web interface, we added logic to look for a custom karls.dashboard.weburl label.
If this label is present on a container, the dashboard card automatically renders a “Launch Web UI” button, allowing you to jump from the status check directly to the application with a single click.
Conclusion: True LoFi Power 💪

This project successfully proves that powerful, custom monitoring doesn’t require complex infrastructure or expensive, bloated software. The final dashboard, running in its own lightweight container and exposed via a simple Cloudflare Tunnel, is the very definition of a LoFi Solution for a Digital World.
By pairing the asynchronous speed of FastAPI for data handling with the drag-and-drop simplicity of the Node-RED Dashboard for visualization, we achieved a custom tool that is:
- Fast: The JavaScript polling and API efficiency ensure near-real-time updates.
- Intelligent: Features like log-based error detection and dynamic stack grouping mean we only get alerted when something truly needs attention.
- Maintainable: The entire application is centralized and built from a single, transparent Python file, making it easy to tweak, update, or expand without disrupting any of the monitored hosts.
If you’re struggling with an overly complex server setup, I encourage you to rethink your approach. Sometimes, the most powerful tool is the one you build yourself to do one thing perfectly. This dashboard is a testament to how bespoke solutions, built with simplicity in mind, can outperform the giants.
What’s Next?
We’re planning to open-source the core of this dashboard.py file soon, so keep an eye on our GitHub page!
Have you used FastAPI or Node-RED for a monitoring solution? What’s your best example of a “LoFi Solution” that saves you time and complexity? Let us know in the comments below!