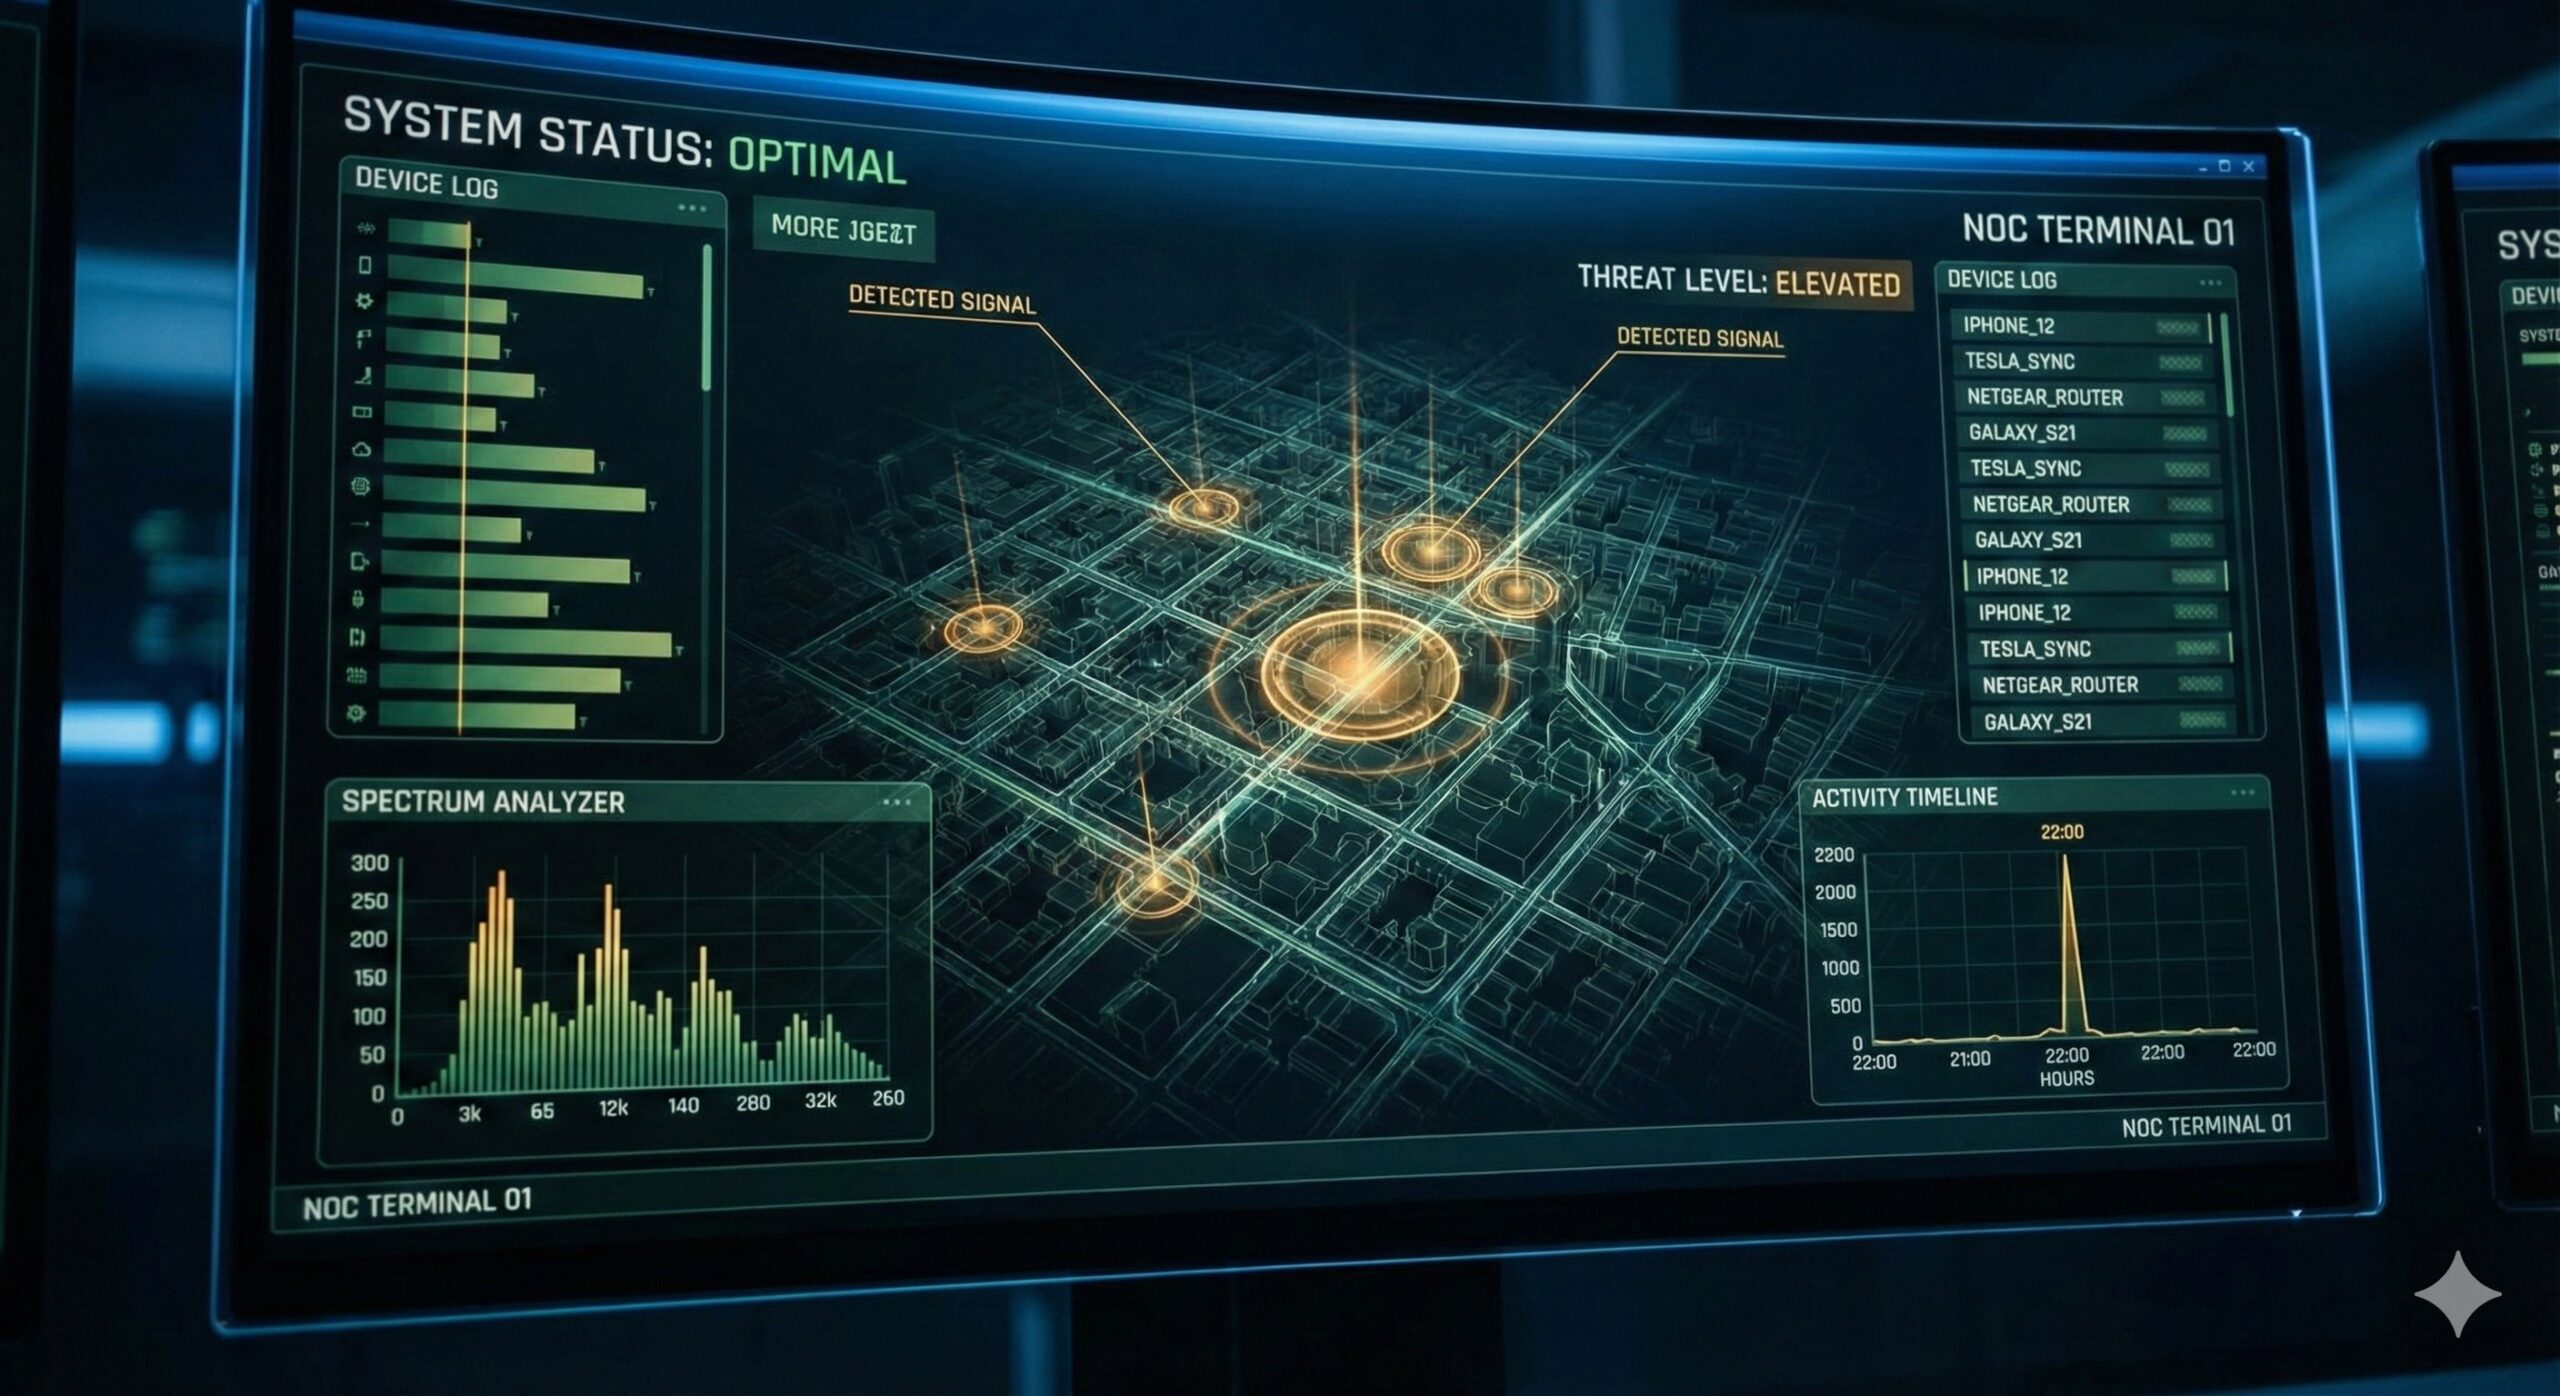
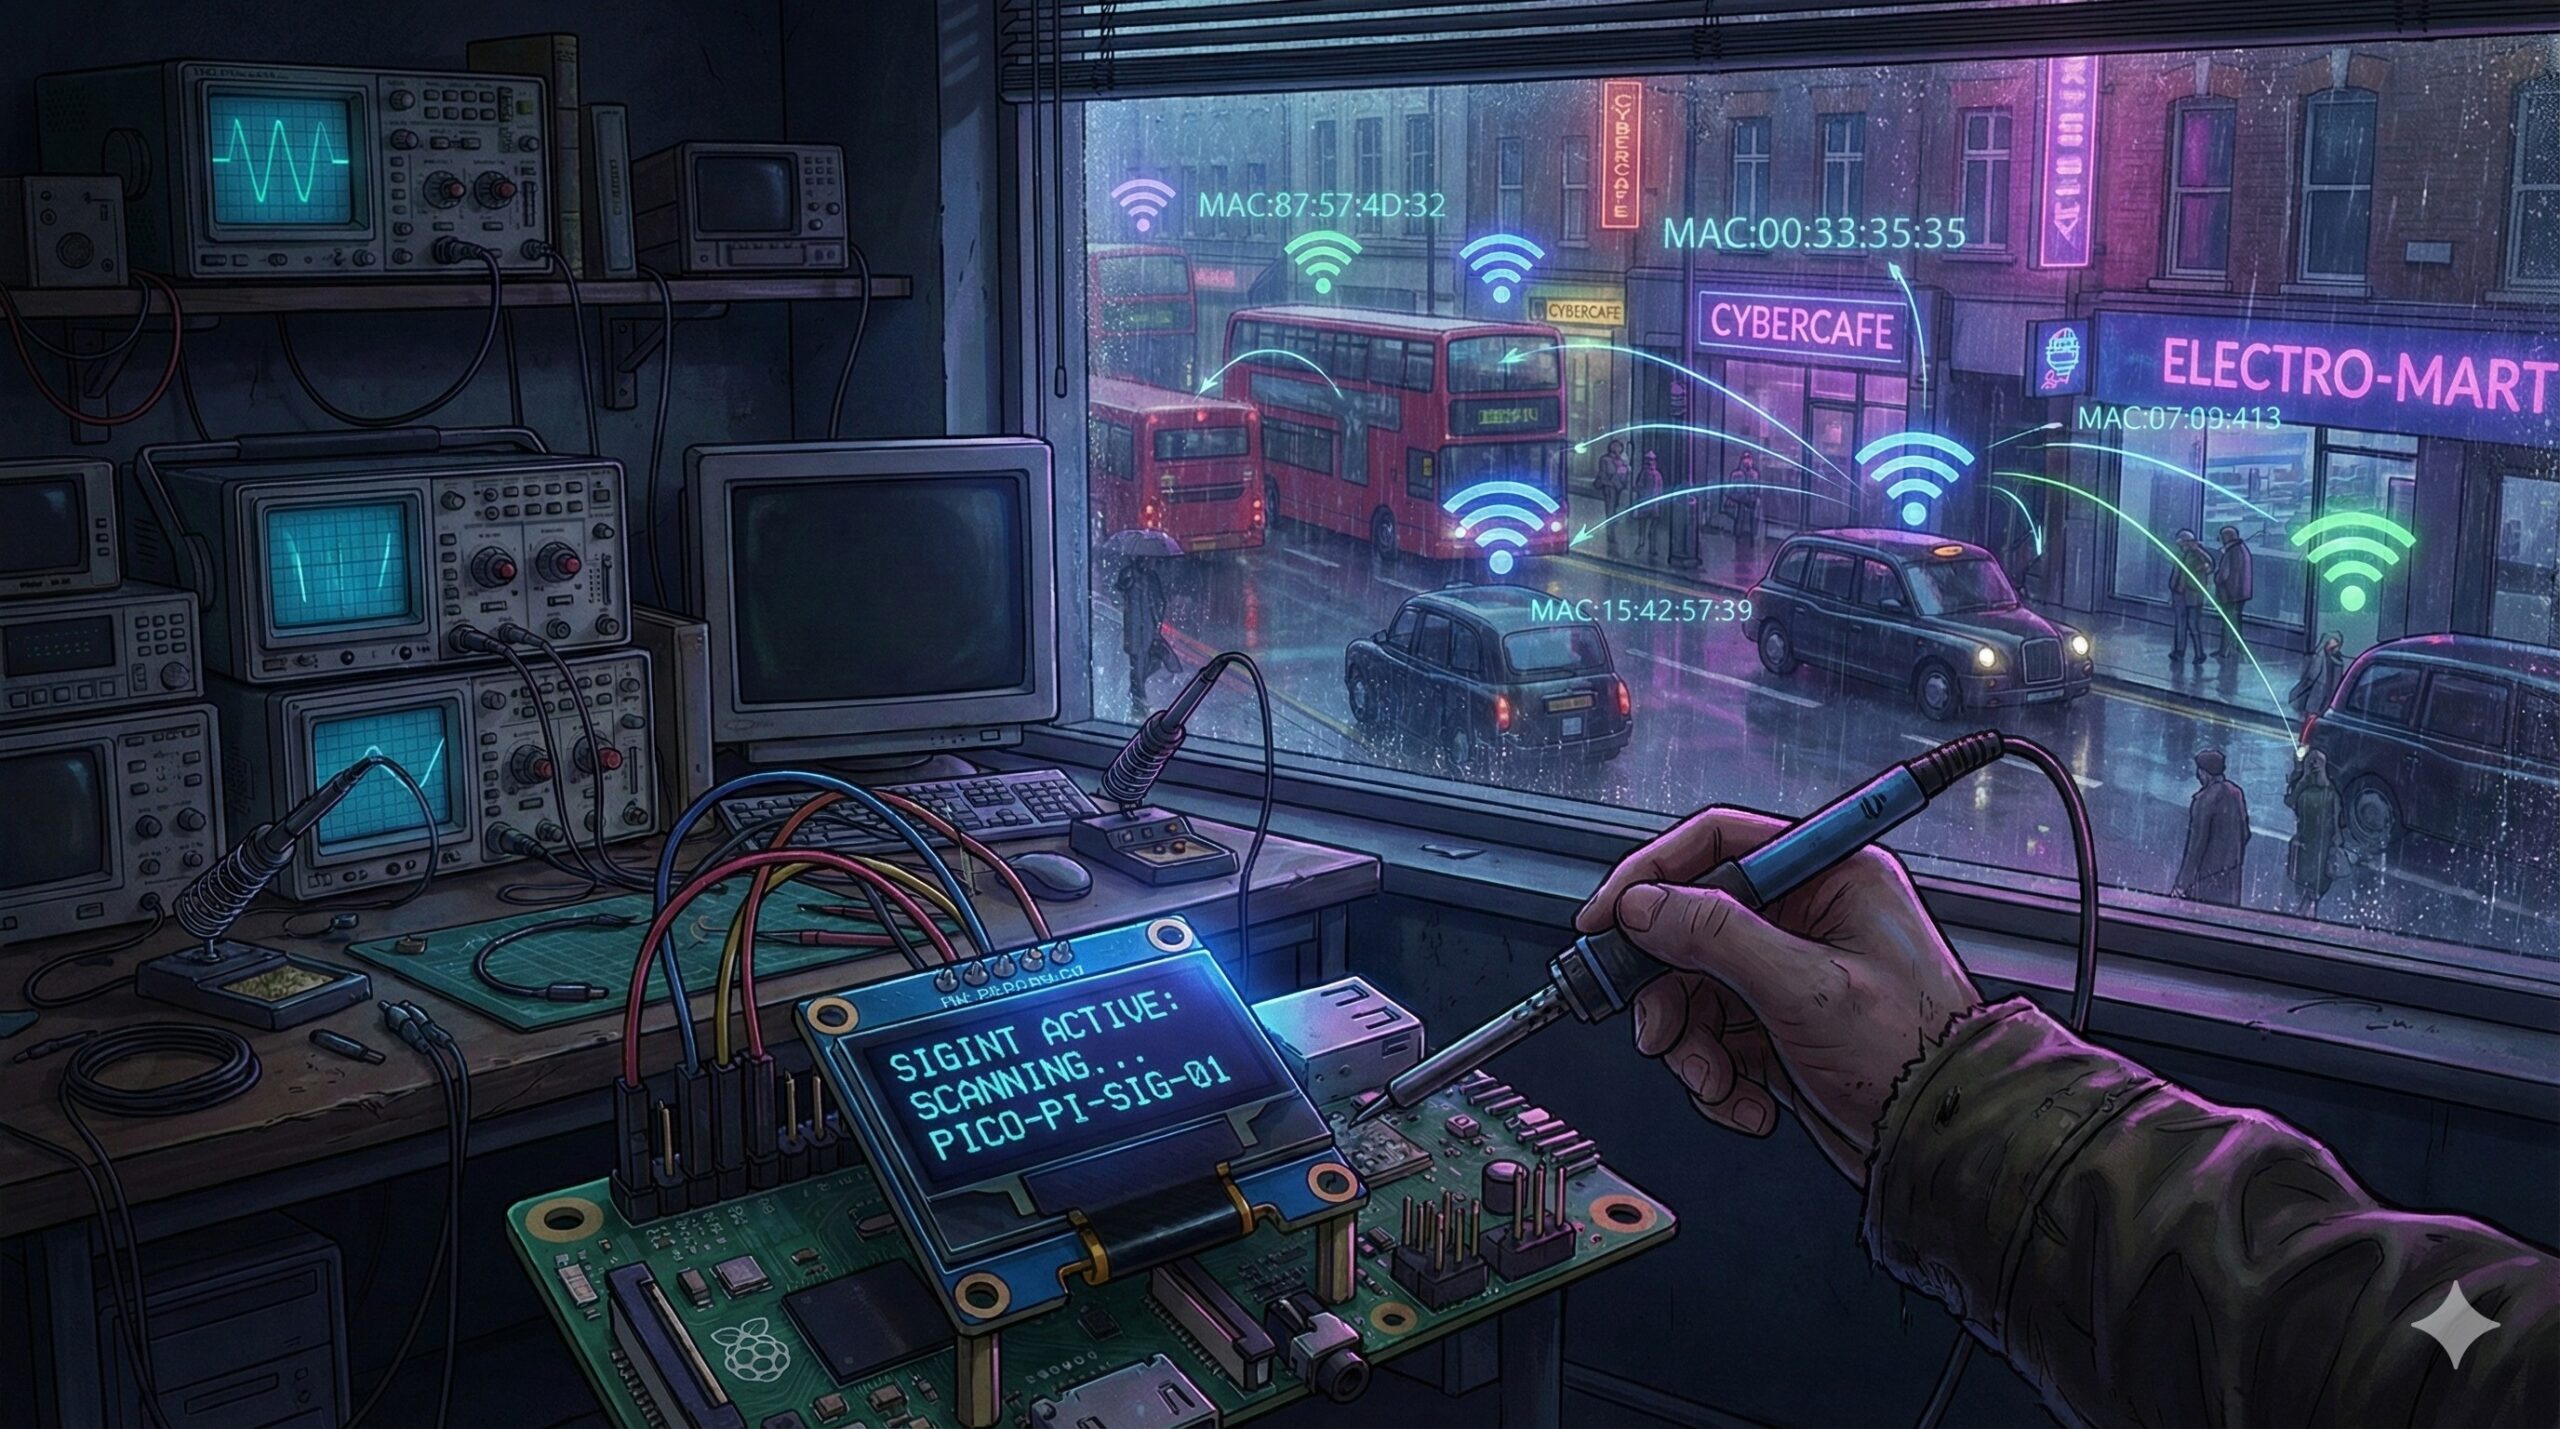
I live on a busy main road. To the naked eye, it’s just traffic—a chaotic stream of metal and people passing within 10 meters of my house. But in the radio spectrum, it’s a rhythmic, predictable data stream waiting to be decoded.
Every smartphone, smartwatch, and modern car infotainment system is constantly shouting into the void: “Here I am! Is my headset nearby? Is my home Wi-Fi here?”
I decided to stop ignoring the noise and start analyzing it.
This isn’t just about counting cars; it’s about Pattern of Life analysis. It is about answering questions that you can’t solve by looking out the window:
- The “Ghost” Parker: Does that specific MAC address appear at 8:00 AM every Tuesday and Thursday? Is it the same commuter parking nearby?
- The Commercial Rhythm: Can I identify the regular buses and delivery trucks just by their Bluetooth signatures?
- The Weather Factor: If I overlay my rainfall data with my scanner data, can I mathematically prove that pedestrian traffic drops by 40% when it rains?
To capture this data, I needed a dedicated listening post—a device that could sit silently, sniff the 2.4GHz spectrum, and log the invisible traffic for later correlation.
Enter Ziggy.
The Mission: Correlating the Invisible with the Physical
My goal was to build a dataset rich enough to find correlations. If you collect enough data points, the chaos of the main road starts to show structure.
- Frequency Analysis: Spotting the “regulars” vs. the “transients.”
- Environmental Correlation: Comparing device density against temperature, rain, or even local events.
- Anomaly Detection: Knowing when the street is weirdly quiet—or suspiciously busy—based on a historical baseline.
To do this, I needed hardware that was small, low-power, and discrete.
The Hardware: The “Ziggy” Nodes
I settled on the Raspberry Pi Pico W. It’s cheap, low-power, and capable of running the Python logic I needed. I built two variants for the Technoshed listening post:
- Ziggy Tactical: The field unit. Equipped with an SSD1306 OLED and a NeoPixel ring, it sits on the desk and gives me real-time visual feedback. It allows me to spot a signal spike instantly.
- Ziggy Mini: The silent sentry. A headless black box tucked away near the window. It has no lights to draw attention, just a radio constantly inhaling data.
The Protocol: “Sniff and Squirt”
The Pico W is a great microcontroller, but it has a limitation: it’s single-threaded when it comes to the radio. It can’t easily sniff Bluetooth packets and maintain a Wi-Fi connection to my server simultaneously.
To get around this, I wrote a logic loop I call “Sniff and Squirt”:
- The Intercept (Sniff): Ziggy goes dark. It shuts down the Wi-Fi uplink and puts the Bluetooth radio into active scan mode. For 10 minutes, it logs every advertising packet—iBeacons, Microsoft Advertising frames, Apple Continuity signals. It stores this “catch” in a temporary CSV file in its flash memory.
- The Exfil (Squirt): Once the buffer is full, Ziggy wakes up its Wi-Fi, connects to the Technoshed secure network, and “squirts” (uploads) the log file to my backend server.
- The Wipe: Once the server confirms receipt (HTTP 200 OK), Ziggy wipes the local evidence and immediately returns to scanning mode to catch the next wave of traffic.
Why do this?
Because the patterns are there, hidden in the noise. We live in a soup of RF signals, and by logging them, we can infer incredible things about the world outside.
In this series, I’m going to document how I built this system—from fighting memory leaks in MicroPython to building a massive SQLite database that allows me to query: “Show me every time this specific BMW passed my house while it was raining.”
Next up: The “Loop of Death” – How I stopped my listening post from choking on its own data.